A/B Test Interference. Quantum Supremacy. Too Many F#$%ing Dashboards. Data Quality. [DSR #207]
❤️ Want to support this project? Forward this email to three friends!
🚀 Forwarded this from a friend? Sign up to the Data Science Roundup here.
This week's best data science articles
Linkedin: Detecting Interference in A/B Tests
This is very cool. I’ve written about interference between groups in A/B testing before (Lyft does a lot of work in this area IIRC) but I’ve never come across quite such a straightforward explanation and clear description of a solution. Defining clusters as experiment groups makes a ton of sense.
Highly recommended read if you work at a company that has any social / marketplace component of your product.
engineering.linkedin.com • Share
Google AI Blog: Quantum Supremacy Using a Programmable Superconducting Processor
You’ve likely read about Google’s quantum supremacy achievement in the mainstream press before now; the post made headlines and came out a month ago at this point. I wanted to take a second to digest this before sharing it to make sure that I had something to say.
The mainstream takes on this has been one of: “this is amazing” or “this is terrible” or “this is a non-event”. My personal take is that 1) this is a Big Deal, but 2) it will take a Very Long Time before anyone reading these words will see a meaningful impact in the practice of their craft.
IMO, the best post on the topic is still from Scott Aaronson, and he favors the comparison to the first achieved human flight by the Wright brothers, sometime between 1903 and 1908. It has the same characteristics that I outline above: human flight was in fact a “big deal” and would change quite a lot about human civilization, but it also would take ~ 3-5 decades to impact the world in a major way. AI was similar: from the first simulation at IBM in the 50’s to ImageNet was ~ 60 years.
This is a fascinating development in the history of computation, but don’t expect PyTorch qubit support any time soon.

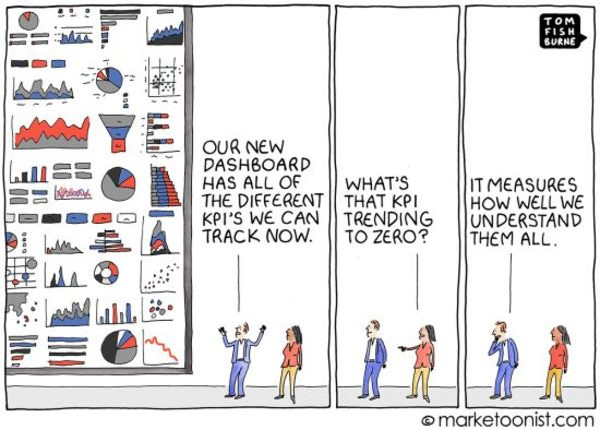
Maybe a dashboard isn’t the answer you’re looking for.
This, like many cartoons, is both hackneyed and useful. It’s hackneyed because we’ve all experienced this situation: too many charts, too many dashboards, not enough thought put into the so what. While this is certainly substandard work, it’s so common that we accept it as the status quo and no longer really “see” the problem. The cartoon is simultaneously useful because, like much art, it makes the invisible visible.
Avinash Kaushik calls reports like this “data pukes”. Not only are data pukes not useful, they actually lead to a loss of credibility for a data culture throughout an organization, a shared shrugging-of-the-shoulders. That’s why this matters.
The thing that most frustrates me is that our tools encourage us to produce this type of work. The rise of Jupyter and the notebook paradigm is the first big push back against this, since notebooks elevate narrative text to being a first class citizen. But the tools that organizations use to disseminate knowledge consider narrative to be of tertiary concern at best.
IMO, there should be a small number of organizational KPIs on a small number of dashboards. Everything else should be a specific investigation including a clear narrative and conclusions, produced at a specific point in time.

Uber: Taking City Visualization into the Third Dimension
3D visualization is a topic not frequently written about. Most datasets don’t have a geo component, and even those that do don’t often care about the Z axis. But Uber’s “aerial ridesharing” business does.
What I found interesting in this article was just how much momentum there is in this space. Here’s a quick snippet:
The 3D Tiles space is abuzz with a steady stream of developments. New tile types are added at a regular cadence to the existing standards and we may even see the introduction of new tile format specifications to cover specialized use cases.
In tandem, tile generation pipelines and backends are rapidly becoming more sophisticated and we expect them to soon be able to convert between tiles of different formats, perhaps even on-demand as tiles are requested.

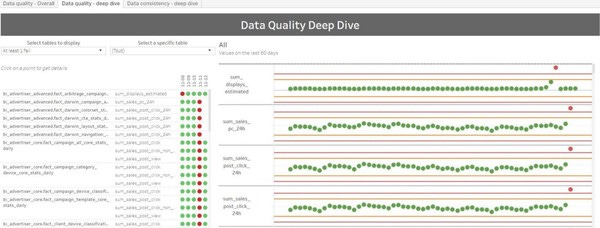
Why Data Quality on Hadoop is key to get the most of your data and how Criteo addressed it.
Criteo has 450 PB of data, 300k jobs, and 7,000 data quality checks.
IMO, data quality is still the most under-invested-in part of the modern data stack. dbt’s current testing functionality goes a long way here, but the Criteo team has done some pretty cool stuff above and beyond where dbt is at the moment. I’m excited to experiment more in this area of the product in 2020.
Can AI Built to ‘Benefit Humanity’ Also Serve the Military?
Microsoft’s $10 billion Pentagon contract puts the independent artificial-intelligence lab OpenAI in an awkward position.
I’m linking to this for two reasons. First, OpenAI has gone through some suboptimal PR of late, and there’s some doubt as to whether it’s actually set up structurally to execute on its stated mission (developing AI technology outside the bounds of government / corporate hands). That’s disappointing but not surprising—idealism doesn’t always generate cash flows, and AI research costs a shitload of money.
Second, I think the conversation about AI / military is interesting, and does not have an obvious answer. I’m concerned about autonomous weapons (to put it mildly) and skeptical of government oversight in this area, but I’m also not completely unsympathetic to this sentiment from Satya Nadella:
“As an American company, we’re not going to withhold technology from the institutions that we have elected in our democracy to protect the freedoms we enjoy.”
If you have nuanced thoughts in this area, I’d love to hear them.
Thanks to our sponsors!
dbt: Your Entire Analytics Engineering Workflow
Analytics engineering is the data transformation work that happens between loading data into your warehouse and analyzing it. dbt allows anyone comfortable with SQL to own that workflow.
Stitch: Simple, Powerful ETL Built for Developers
Developers shouldn’t have to write ETL scripts. Consolidate your data in minutes. No API maintenance, scripting, cron jobs, or JSON wrangling required.
The internet's most useful data science articles. Curated with ❤️ by Tristan Handy.
If you don't want these updates anymore, please unsubscribe here.
If you were forwarded this newsletter and you like it, you can subscribe here.
Powered by Revue
915 Spring Garden St., Suite 500, Philadelphia, PA 19123

