
Announcing: The Analytics Development Lifecycle (ADLC)
The full 25-page whitepaper launched earlier this week
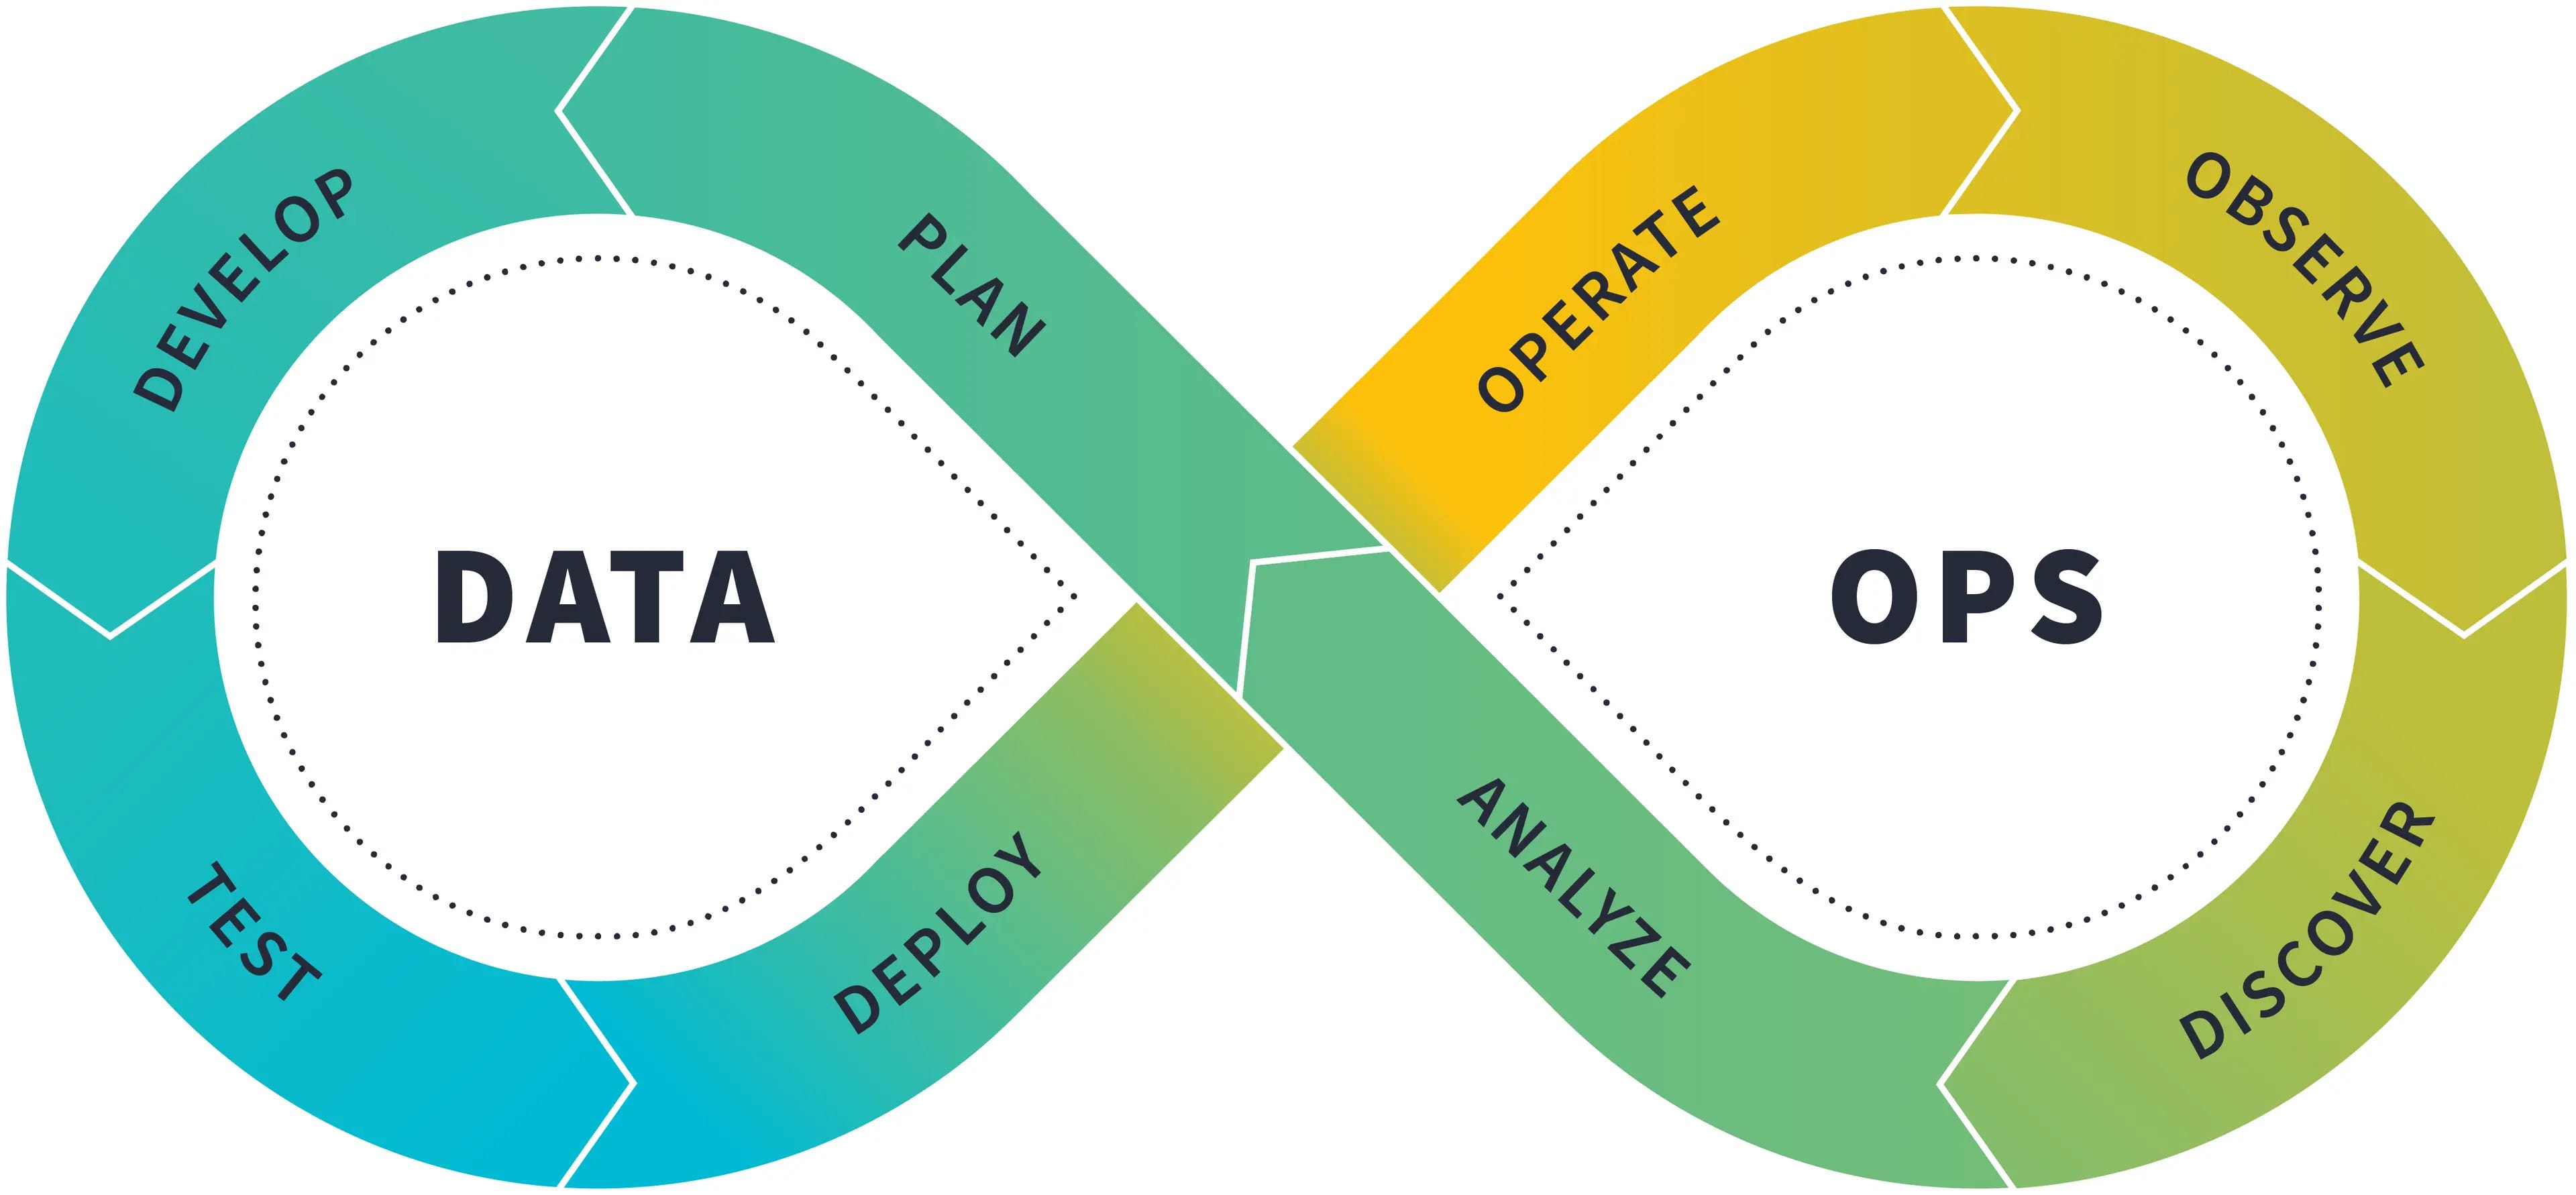
The Analytics Development Lifecycle.
Full white paper here. (Soon to be packaged up as a downloadable PDF, but I didn’t want to wait for that to get this into your hands.)
===
I’ve teased the work I’m doing on the ADLC over the last few issues of this newsletter. The white paper has been a major lift for me over the past ~3 months and is really the product of ~8 years of being on the journey of bringing software engineering best practices into analytics.
The final result is somewhat long (25 pages in PDF form!) but simultaneously concise given how much it covers. I highly recommend skimming the entire thing, and then saving it as a resource to return to on an ongoing basis.
Mostly what I want to do with this newsletter is simply to share the link; that’s more than enough reading for your Sunday morning :) But I figured I’d also answer two other questions:
Why write this now?
What are early responses like?
Why now?
I address this specifically in my intro:
…nearly a decade later, it is clear to me that the original post is in need of an update.
Why? First, we now have the collective experience of tens of thousands of companies applying these ideas. We can observe from dbt product instrumentation data that a large majority of companies that transition to the cloud adopt at least some elements of a mature analytics workflow—particularly related to data transformations. But what about the other layers of the analytics stack?
Here is what I mean:
At your company, do you believe that notebooks and dashboards are well-tested and have provable SLAs?
Do your ingestion pipelines have clear versioning? Do they have processes to roll back schema changes? Do they support multiple environments?
Can data consumers request support and declare incidents directly from within the analytical systems they interact with? Do you have on-call rotations? Do you have a well-defined incident management process?
The answer to these questions, for almost every company out there, is “no.”
The fact is that we—the entire data community—have not rolled out these ideas to all layers of the analytics stack, and this leads to bad outcomes: impaired trust in data, slow decision-making velocity, low quality decisions. We have pushed back this tide within the narrow domain of data transformation; it is time to apply these lessons more broadly across the entire analytics workflow.
We need to collectively acknowledge that we are not done, that there is further to go on this journey.
To be honest, watching the conversation in data over the past few years has been frustrating to me, specifically because I see so many people taking a victory lap. I feel like many of us have put on blinders. We improved a lot, and very quickly, and we should be justly proud of that progress. But we cannot stop pushing forwards. Real problems remain.
What are early responses like?
Releasing this white paper has been incredibly satisfying. In every context, whether online or in person, the response has been overwhelmingly positive.
One of the wild things to me is that, if you googled “analytics development lifecycle” two months ago, you got basically nothing interesting. The SDLC is so widely-understood that it is taught in computer science classes throughout the world, but no one has popularized the idea of the ADLC until now? Including us? What a missed opportunity.
For years, we talked about this as “the dbt workflow,” but that had two problems:
What exactly “the dbt workflow” meant was not well-defined.
Defining a workflow by referencing a product is a bad idea. The ADLC is bigger than any single product. Sure, dbt has a role to play, but so do many other products.
So: it was time to name the thing and specify it. Because this is ultimately what we in the dbt Community have been trying to work towards for years now.
The most fun thing for me has been when I get to introduce the idea of the ADLC in live conversations. I have now done this in multiple large group settings, in small group settings with practitioners, and in meetings with senior leaders. Everyone always gets it immediately. And the real validation is that they start using it in their own words. When someone starts using a new term in their own way, that’s when you know it’s useful.
===
My hope is that this white paper is bigger than me, bigger than dbt, that it’s about a thing that we are all trying to collectively work towards but hadn’t yet been able to name. And my hope is that by naming it we’ll be able to talk about it better and to make progress faster.
I’d love it if you could forward it to others in your network. It’s 100% ungated, no email forms to fill out.
And, of course, I’ll be talking a lot about the ADLC on stage at Coalesce in a few weeks! Hope to see you there :D
- Tristan
Hi Tristan. Interesting post and I am happy to see practitioners trying to tackle the full lifecycle of analytics.
There are many good parts to this, and for people new to the space, your piece summarizes many important aspects of the modern data stack. Since it is already a good preliminary summary, I will instead add some constructive criticism on a handful of areas where I think more explanation could be useful.
In the `Intro`, you mention 4 types of truth claims: descriptive, causal, predictive and prescriptive. What I think is important to note, and to spend more time on at some point (though today it evades much of the modern data stack), is the correlative nature of the last 3. Causation (“if this occurs, then that will occur”), prediction (“given this, we will observe that”) and prescription (“if I do this, then that will occur”) are all correlative in nature. In particular - and in contrast to univariate descriptive statistics (“reporting”) - we are looking at the relationship between two or more variables. We know the answer to this lies in statistics/data science/machine learning/causal inference, but your piece does not really make mention of these.
When I think of “analytics”, I think of developing an understanding of the data. Certainly, this includes univariate, descriptive reporting. Business intelligence. Dashboards. This is where dbt shines. But I also think of “if-then” causality. “Why did this go up?” “Will that go up if we do this?” Many, many analytical questions are attempts to infer causality (though, in practice, this is quite difficult, so we settle for correlation, and thus the vast majority of statistics) - in other words, how a system works. What levers affect which outputs. As data practitioners, we are stuck with the data, but the analytical nature of our job is to statistically infer the “data generating process” (DGP) - that is, the shape of the system itself.
As a result, I think it’s a stretch to reach for the mantle of “analytics” when, so far, we’re really just talking about reporting. Displaying data is admittedly, in its own right, very difficult to do correctly/reliably/durably/comprehensibly/”auditably”/performantly/resiliently, and I think you emphasize more or less the right points here.
In your `Requirements of a mature analytics workflow`, some additional requirements - which maybe you are placing into existing categories - could include: Durability (what if someone deletes the staging table in Snowflake?), Semantics (Governance generally includes this, though your description mostly focuses instead on regulatory compliance), Discoverability (also under Governance), and Monitoring/Observability (perhaps this falls into Reliability, though monitoring is such an important space - DataDog, Splunk, New Relic, etc. - that the keyword I believe deserves a mention).
In the `Stakeholders of the ADLC`, I mostly agree with these, though I do think there is a “researcher” persona which is different from the others. Perhaps you are placing it under the analyst - which is reasonable - though in practice the skills of a researcher (statistics, econometrics, data science) overlap almost not at all with the typical data/business analyst, who instead needs business context, dashboard skills, PowerPoint/Excel, and maybe a bit of pandas. For the 3 roles as you have them, I personally differentiate them by what they are trying to accomplish: to assemble the data, to understand it, and finally, to act on it.
In the `Hats, not badges` section, the word that jumped to mind to me was “full-stack analytics” - i.e. we ought not to be strictly confined to our title’s narrow domain.
In the `ADLC model` section, I don’t necessarily agree that “analytical systems are software systems.” PowerPoint for example is an integral part of how we communicate our analyses to stakeholders. It is absolutely the case that an “analysis” today is memorialized in a 10-slide deck, and frankly, I think this is the best output for it. Perhaps it is debatable whether that should be the case, but I think it is unobjectionable that most analyses today are conveyed through presentation format. In fact, one distinction I find between a dashboard (live) and a PowerPoint (static) is precisely due to the fact that a PowerPoint is static: we are taking a stance (snapshot) at a particular point of time (of the data) and making a recommendation (today) because of it. Looking at a live dashboard does not achieve this; the narrative nature of a PowerPoint does.
Exploratory data analysis, in my experience, is also not really a software system. I fully anticipate that 90% of our research is throwaway work. So it is the case with all science. Of course the last 10% we do indeed memorialize as code and it is checked into VCS, but 90% is not, and it does not adhere to most software principles. I often differentiate between “research code” and “software code”, and research code exists because it provides a useful, albeit transitory, purpose. I would say that “reporting systems” or “BI systems” are indeed software systems, but analytical systems more generally seems like a bit of a far reach.
In the `Discover and Analyze` section, you discuss `Discover` in detail (mostly a lot of governance items) but I feel like the `Analyze` section is lacking.
Overall, I think it is a good introductory post, although I imagine a comprehensive explanation of the “Analytics Development Lifecycle” would likely necessitate more of a book-length review. I look forward to reading more!
Announcing the Analytics Development Lifecycle (ADLC), a structured approach to building and managing data solutions. For <a href="https://busimulatorultimate.com/">Bus Simulator Ultimate</a>Mod Apk, ADLC can streamline the process of collecting, analyzing, and visualizing gameplay data. It helps developers optimize features, track player behavior, and enhance the game by following a clear, iterative analytics workflow.