Building an Analytics Team. Wildfires. Spiking Neural Networks (?!?) [DSR #119]
❤️ Want to support us? Forward this email to three friends!
🚀 Forwarded this from a friend? Sign up to the Data Science Roundup here.
Building The Analytics Team At Wish
…We now have over 30 people dedicated to working on analytics, with plans to double that number this year. We’re confident that our systems and processes can scale, and that we can meet any future demand held by the company. In this post, I’m going to share the lessons we learned, and offer a roadmap for other companies looking to scale their analytics function.
This is a stellar read—it’s quite detailed, and this is only the first of four parts (all already published and linked in the intro). If you’re scaling an analytics team today this is your playbook.
Yann LeCun: Deep Learning has outlived its usefulness
Short, very interesting:
People are now building a new kind of software by assembling networks of parameterized functional blocks and by training them from examples using some form of gradient-based optimization. (…) It’s really very much like a regular program, except it’s parameterized, automatically differentiated, and trainable/optimizable.
I apologize in advance for linking to a Facebook post, but Yann does work there so I guess he’s partial.

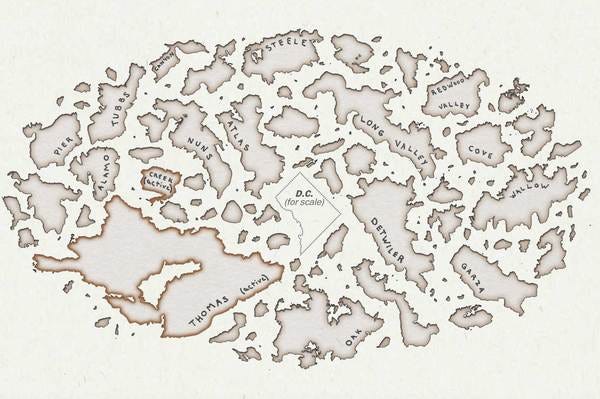
The image above is of all the wildfires in 2017, with D.C. in the center for scale. California was the big “winner” this year:
Nearly 9,000 wildfires tore through the state, burning 1.2 million acres of land (an area the size of Delaware), destroying more than 10,800 structures and killing at least 46 people.
Such a great use of visualization to bring home the point of an important story.
www.washingtonpost.com • Share
Spiking Neural Networks, the Next Generation of Machine Learning
This was completely new for me—I had never heard of a “spiking neural network”. After reading this post I was interested yet somewhat dubious, but it turns out that there is indeed a niche academic field behind this. The basic concept is more closely mimicking the function of the biological neuron to more effectively sense time series data.
This is not a “use it tomorrow” type of article, but definitely something you should add to your vocabulary and watch in coming months and years.
towardsdatascience.com • Share
Visualizing the Uncertainty in Data
Data is a representation of real life. It’s an abstraction, and it’s impossible to encapsulate everything in a spreadsheet, which leads to uncertainty in the numbers. (…) Here are some visualization options for the uncertainties in your data, each with its pros, cons, and examples.
Very, very good.
Understanding Feature Engineering (Part 2) — Categorical Data
I linked to the first part in this series on continuous data last week and it seems to have resonated. This post is an excellent continuation.
towardsdatascience.com • Share
What if I told you database indexes could be learned?
From a recent paper at NIPs, and a subject that I found fascinating. Indexes are responsible for the blazing performance in most transactional database systems, but the index data structures they use haven’t changed in many years.
towardsdatascience.com • Share
Data viz of the week

Whoah! What a fun pattern, and perfect viz for it.
Thanks to our sponsors!
Fishtown Analytics: Analytics Consulting for Startups
At Fishtown Analytics, we work with venture-funded startups to implement Redshift, Snowflake, Mode Analytics, and Looker. Want advanced analytics without needing to hire an entire data team? Let’s chat.
Stitch: Simple, Powerful ETL Built for Developers
Developers shouldn’t have to write ETL scripts. Consolidate your data in minutes. No API maintenance, scripting, cron jobs, or JSON wrangling required.
The internet's most useful data science articles. Curated with ❤️ by Tristan Handy.
If you don't want these updates anymore, please unsubscribe here.
If you were forwarded this newsletter and you like it, you can subscribe here.
Powered by Revue
915 Spring Garden St., Suite 500, Philadelphia, PA 19123

