Data Science Roundup #79: Complete Guide to Startup Analytics, Why People are Leaving Data Viz, & more!
Thanks for reading! It’s an honor to be in your inbox, as always.
- Tristan
Referred by a friend? Sign up here!
Two Posts You Can't Miss

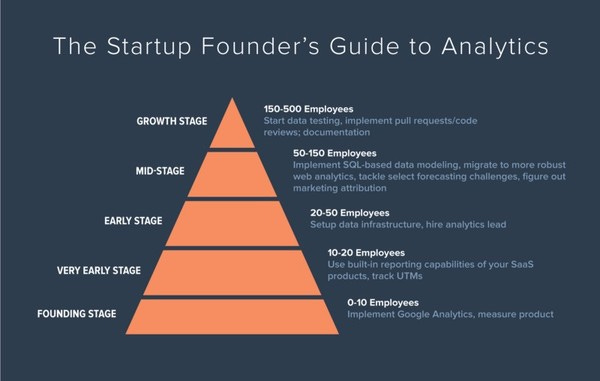
The Startup Founder's Guide to Analytics
This post is about how to create the analytics competency at your organization. It’s not about what metrics to track (there are plenty of good posts about that), it’s about how to actually get your business to produce them. As it turns out, the implementation question — How do I build a business that produces actionable data?—is much harder to answer.
This is my most recent blog post, written based on our experience working with over a dozen VC-backed startups. If you work in analytics at a startup, this post was written for you.
If you have a Medium account, please give this a quick ❤️—the Medium distribution algorithm really loves them. Thanks :)
If Data Visualization is So Hot, Why Are People Leaving?
Elijah Meeks, a data visualization engineer @ Netflix, created quite a bit of conversation this past week with this post. Here’s the core of it:
…because you’re hired to do data visualization but only asked to do the most simple version of it, jobs advertised as being about data visualization leave little room for technical innovation. The putative data visualization engineer need only spend a couple hours a week making bar and line charts, and therefore has more than enough time to work on the important parts of an application: the API, the build process, the data stores, and everything but the actual communication of data using graphics. That’s a story I keep hearing here in Silicon Valley and a story that ends with the teller either asking me how to fix it or telling me how she’s transitioned out of data visualization into a different position.
This has resonated with many folks, with a lengthy back-and-forth on Twitter and a great response post on Medium.
This Week's Top Posts
Facebook’s Prophet, released about a month ago, has become a popular way to do forecasting. It uses Stan, a probabilistic programming language, under the hood, which gives your models confidence intervals out of the box. This FFL teardown of Prophet is worth the read if you anticipate any forecasting in your near future.
blog.fastforwardlabs.com • Share
I covered it a year ago when Facebook released their auto-captioning functionality. The video, and the tech behind it, felt like magic at the time. One year later you can do this yourself with public data, TensorFlow, and a little bit of transfer learning. Just…wow.
The AI Class Facebookers Are Sprinting to Get Into
Internet giants have vacuumed up the world’s AI talent, but they still need more. Now they’re trying to cultivate it in-house.
Very interesting from a Silicon Valley / culture perspective. Not technical.
A successful Git branching model
I run into many, many analysts who are not at all familiar with Git. Even once they get set up, it’s still unclear how to use it optimally.
This post is old, but it’s absolutely gospel when it comes to thinking through an effective Git workflow. While it’s written for application developers, the concepts are directly translatable into analytics organizations.
If you’re using Git to manage your analytic code, I’d be very curious to hear what your workflow looks like—shoot me an email.
This post makes a really, really good point: in order to be able to use a language, you need to practice it, not just learn it. Taking a class or watching a video doesn’t make the neuronal connections you need to be able to use that language to solve real problems. There are no shortcuts.
Data viz of the week

100 year history of famine in a single visualization.
Thanks to our sponsors!
Fishtown Analytics: Analytics Consulting for Startups
Fishtown Analytics works with venture-funded startups to implement Redshift, Snowflake, Mode Analytics, and Looker. Want advanced analytics without needing to hire an entire data team? Let’s chat.
Stitch: Simple, Powerful ETL Built for Developers
Developers shouldn’t have to write ETL scripts. Consolidate your data in minutes. No API maintenance, scripting, cron jobs, or JSON wrangling required.
The internet's most useful data science articles. Curated with ❤️ by Tristan Handy.
If you don't want these updates anymore, please unsubscribe here.
If you were forwarded this newsletter and you like it, you can subscribe here.
Powered by Revue
915 Spring Garden St., Suite 500, Philadelphia, PA 19123

