Data Science Roundup #82: "Statsplaining", NBA Fouls, and Effective Data Engineering Teams!
Our friends at Casper are looking for two data analysts! The Casper data team does great work; I couldn’t recommend these opportunities more highly. Check out the job postings here.
Enjoy :)
- Tristan
Referred by a friend? Sign up here!
Two Posts You Can't Miss

Seeing Theory: A Visual Introduction to Probability and Statistics
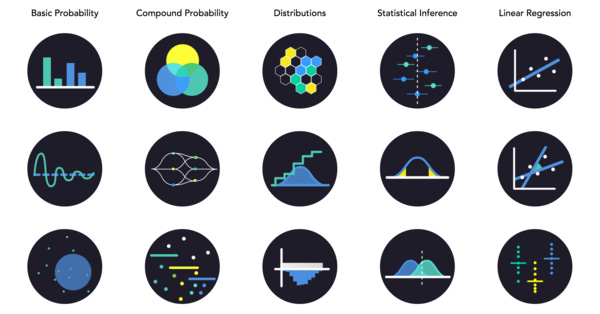
“Statsplaining"—explaining to statistical concepts or conclusions to non-statisticians—is hard. Thinking in statistics often feels foreign to people who don’t spend a lot of their time in this mental space. The resulting communication gap is typically bridged with awkward metaphors and blank stares.
The next time you find yourself in a situation like this, consider pulling out this website. It contains a series of useful interactive graphics that you can use to illustrate statistical concepts. Your listeners will appreciate your newfound ability to explain difficult concepts visually.
NBA Foul Calls and Bayesian Item Response Theory
There are few people who care less about the NBA than me. Even so, this analysis blew me away with its depth and clarity. A note on the dataset:
Since 2015, the NBA has released a report reviewing every call and non-call in the final two minutes of every NBA game where the teams were separated by five points or less with two minutes remaining.
There are four major takeaways from the analysis, all of which are questions that NBA fans have long speculated about. Here’s my favorite:
There is a positive relationship between player salary and the probability that a foul is called when they are disadvantaged and not called when they are committing. With a bit of a leap, we can say that the probability a foul is called is at least loosely related to the “star power” of the players involved.
I can’t wait to hear announcers attempting to cite this.
This Week's Top Posts
What is a Productive Data Engineering Team?
This whole post is amazing. Here’s my favorite paragraph:
Once a data pipeline is first released, it doesn’t stay at its initial usage; it almost always grows. There is pent-up demand for data products that the pipeline starts to facilitate. New data sets and data sources will get added. There will be new processing and consumption of data. In a complete technical free-for-all, you will end up with issues. Often, teams that lack qualified data engineers will completely misuse or misunderstand how the technologies should be used.
A Guide to AI Accelerators and Incubators
If you’re thinking about, or currently in the process of, starting a business with a focus on AI, this post is a must-read. While there is plenty of interest from the investment community in the category, you need to know how to navigate the space to choose your partners.
Don’t let your cap table drag you down.
H-1B Visa Petitions Data Analysis using R
This post is one of a four-part series going from raw data to conclusions. For a topic that is highly politicized and frequently in the news right now, I was surprised at how much of this was new information.
sharan-naribole.github.io • Share
Investigating the style of self-portraits (selfies) in six cities across the world.
Not useful; very interesting—1) seeing what is possible to detect algorithmically from faces and 2) seeing what types of selfies we like to take 😘
The Centre Can Indeed Hold in France’s Presidential Election
The upcoming French elections are fascinating, to me, because of the very distinct voting mechanism employed in France. The French system creates a completely different election dynamic from what we’re used to in the US, which seems right now to be favoring the centrist candidate (Macron). This post is a great overview of the dynamic and the polling data behind it.
How Data Helps Today’s Airlines Operate
If you’ve been fascinated by the United saga recently, this is an interesting post on the ways in which airlines use data in their operations. It’s painful watching legacy organizations attempt to adopt new technologies—I can’t help but wonder if there will be a Stitch Fix of airlines that emerges in the near future.
Data viz of the week

Renewable energy is getting cheap! Simple; effective.
Thanks to our sponsors!
Fishtown Analytics: Analytics Consulting for Startups
At Fishtown Analytics, we work with venture-funded startups to implement Redshift, Snowflake, Mode Analytics, and Looker. Want advanced analytics without needing to hire an entire data team? Let’s chat.
Stitch: Simple, Powerful ETL Built for Developers
Developers shouldn’t have to write ETL scripts. Consolidate your data in minutes. No API maintenance, scripting, cron jobs, or JSON wrangling required.
The internet's most useful data science articles. Curated with ❤️ by Tristan Handy.
If you don't want these updates anymore, please unsubscribe here.
If you were forwarded this newsletter and you like it, you can subscribe here.
Powered by Revue
915 Spring Garden St., Suite 500, Philadelphia, PA 19123

