Data team structure. Cloud Data Management. GDPR. More Polynote(!). AI Talking Trash. [DSR #204]
❤️ Want to support this project? Forward this email to three friends!
🚀 Forwarded this from a friend? Sign up to the Data Science Roundup here.
This week's best data science articles
How should I structure my data team? A look inside HubSpot, Away, M.M. LaFleur, and more
The data team is a brand new thing: it’s not IT, it’s not finance, it’s not any of the typical business functions within an operating business. So…who does it report to? How does it interact with the rest of the organization? How big is it?
These are all questions that are getting answered in real-time throughout the industry. And they’re likely questions that you have as you go about constructing, or re-architecting, your data team. As of today, there are no clear answers. Companies are answering these questions in a bunch of different ways, all customized to their particular businesses.
Fantastic, well-researched piece by the Fishtown Analytics team.
Introduction to Cloud Data Management: A Book
This book is for anyone looking to setup an effective, modern (typically cloud-based) data stack that will truly enable a company to explore and understand the data it collects to have high visibility into their business. It’s for people who value their data and realize that a company that is truly informed by their data has significant competitive advantages.
This is a fantastic resource! It won’t be brand new for most readers of the Roundup but it is, to my knowledge, the single most comprehensive resource to get someone up to speed on modern data management. All of the prior art in this space is at least a decade old (if not more), and much of it can be ignored.
Highly recommended resource to share with folks in your network. Far too many people still don’t know this stuff!

Microsoft open sources SandDance, a visual data exploration tool
For those unfamiliar with SandDance, it was introduced nearly four years ago as a system for exploring and presenting data using “unit visualizations.” Instead of aggregating data and showing the resulting sums as bar charts, SandDance shows every single row of a dataset (for datasets up to ~500K rows). It represents each of these rows as a mark that can be colored and organized into different areas on the screen.
I hadn’t been familiar with SandDance before, but I think it’s a part of an interesting trend to use visualization to represent all of the data, not just descriptive statistics of the data.
cloudblogs.microsoft.com • Share

When Americans Reach $100k in Savings
Neat data journalism piece on millennial savings rates and asset accumulation. I haven’t linked to a ton of data journalism work recently but really enjoyed this.
What You Need to Know About Polynote
This is exactly the post I needed! I linked to a post about Polynote, Netflix’s new open source notebook, last week. This post does a great job of actually comparing/contrasting it to Jupyter, with which you’re likely intimately familiar. The differences are actually quite nice—it’s great to see, for example, that state doesn’t depend on cell execution order (what a relief).
Short, digestible. This post had me wanting to scrape some time out of my schedule to give Polynote a spin.
towardsdatascience.com • Share

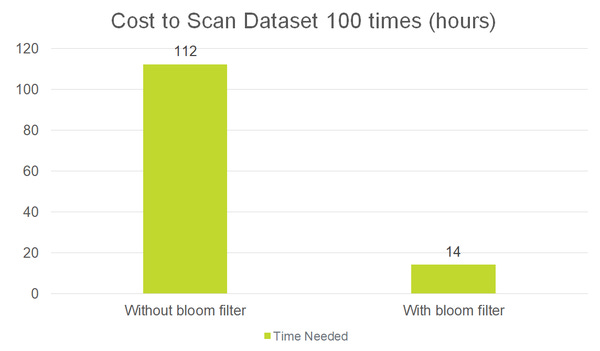
Search Optimization for Large Data Sets for GDPR
I haven’t personally been involved with large-scale GDPR projects, but this is a fascinating problem: the cost to simply scan the raw data once per deletion request is very high. The article presents an interesting use case for bloom filters.
Coding Habits for Data Scientists
Fantastic resource for writing good data science code. If you have anyone on your team who still feels like writing notebook after notebook of unmaintainable code is the way to do data science, send this their way.
A Robot’s Expressive Language Affects Human Strategy and Perceptions in a Competitive Game
Holy shit—AI researchers are giving their systems a competitive edge by teaching them to trash talk:
As robots are increasingly endowed with social and communicative capabilities, they will interact with humans in more settings, both collaborative and competitive. We explore human-robot relationships in the context of a competitive Stackelberg Security Game. We vary humanoid robot expressive language (in the form of “encouraging” or “discouraging” verbal commentary) and measure the impact on participants’ rationality, strategy prioritization, mood, and perceptions of the robot. We learn that a robot opponent that makes discouraging comments causes a human to play a game less rationally and to perceive the robot more negatively.
Wild.
Thanks to our sponsors!
dbt: Your Entire Analytics Engineering Workflow
Analytics engineering is the data transformation work that happens between loading data into your warehouse and analyzing it. dbt allows anyone comfortable with SQL to own that workflow.
Stitch: Simple, Powerful ETL Built for Developers
Developers shouldn’t have to write ETL scripts. Consolidate your data in minutes. No API maintenance, scripting, cron jobs, or JSON wrangling required.
The internet's most useful data science articles. Curated with ❤️ by Tristan Handy.
If you don't want these updates anymore, please unsubscribe here.
If you were forwarded this newsletter and you like it, you can subscribe here.
Powered by Revue
915 Spring Garden St., Suite 500, Philadelphia, PA 19123

